Release notes 2.6.0
|
Product |
EclecticIQ Platform |
|
Release version |
2.6.0 |
|
Release date |
12 Dec 2019 |
|
Summary |
Minor release |
|
Upgrade impact |
Medium |
|
Time to upgrade |
~30 minutes to upgrade
|
|
Time to migrate |
|
EclecticIQ Platform 2.6.0 is a minor release. It contains new features, improvements to existing functionality, as well as bug fixes.
The main goal of EclecticIQ Platform 2.6.0 is to enhance the analysts' experience, in line with our commitment to building a truly analyst-centric threat intelligence platform. This release brings a number of enhancements and changes to the platform aimed at improving the flow of day-to-day operations to save time and to increase productivity.
First, we are pleased to share the news that analysts can now leverage many graph improvements powered by the brand-new graph engine we introduced with the previous release. The new graph engine provides an improved experience when updating, filtering, displaying, and sharing graphs.
Besides the graph, EclecticIQ Platform 2.6.0 delivers multiple improvements also to its search engine, making it easier for analysts to explore the full collection of intelligence in the repository. You can now more easily delve into the available intelligence thanks to autocomplete search history, search by destination. and search by relationships.
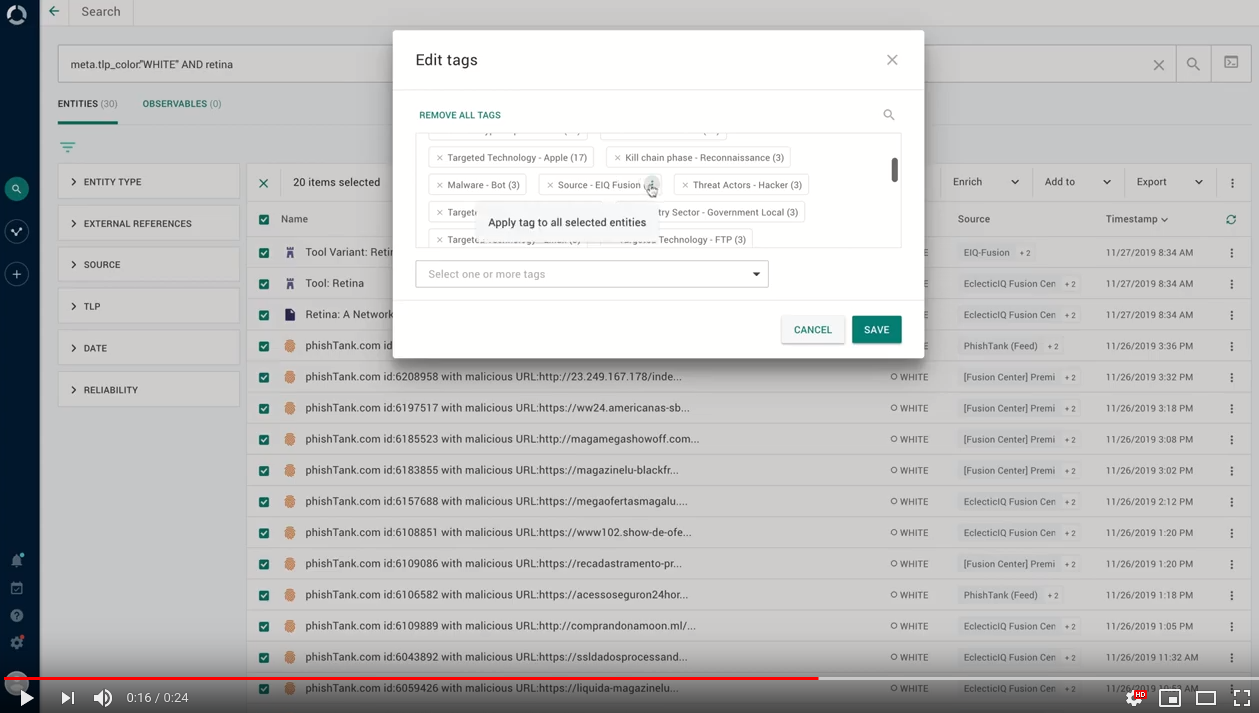
Finally, we changed the user interface sections where users can create and edit entities, resulting in smoother workflows. We also enhanced usability by bringing back the original way of managing tags for individual entities, and by more clearly highlighting the tags multiple entities have in common.
We hope you enjoy reading these release notes – now accompanied by short feature videos for your convenience – and watching the quick tour video from the team.
Follow the link and check out the new quick tour video from the team for a short rundown of these highlights.
For more information about enhancements and improvements, see What's changed below.
For more information about bugs we fixed, see Important bug fixes below.
For more information about security issues we addressed, see Security issues and mitigation actions below.
Download
Follow the links below to download installable packages for EclecticIQ Platform 2.6.0 and its dependencies.
For more information about setting up repositories, refer to the installation documentation for your target operating system.
|
EclecticIQ Platform and dependencies |
|
|
EclecticIQ Platform extensions |
Upgrade
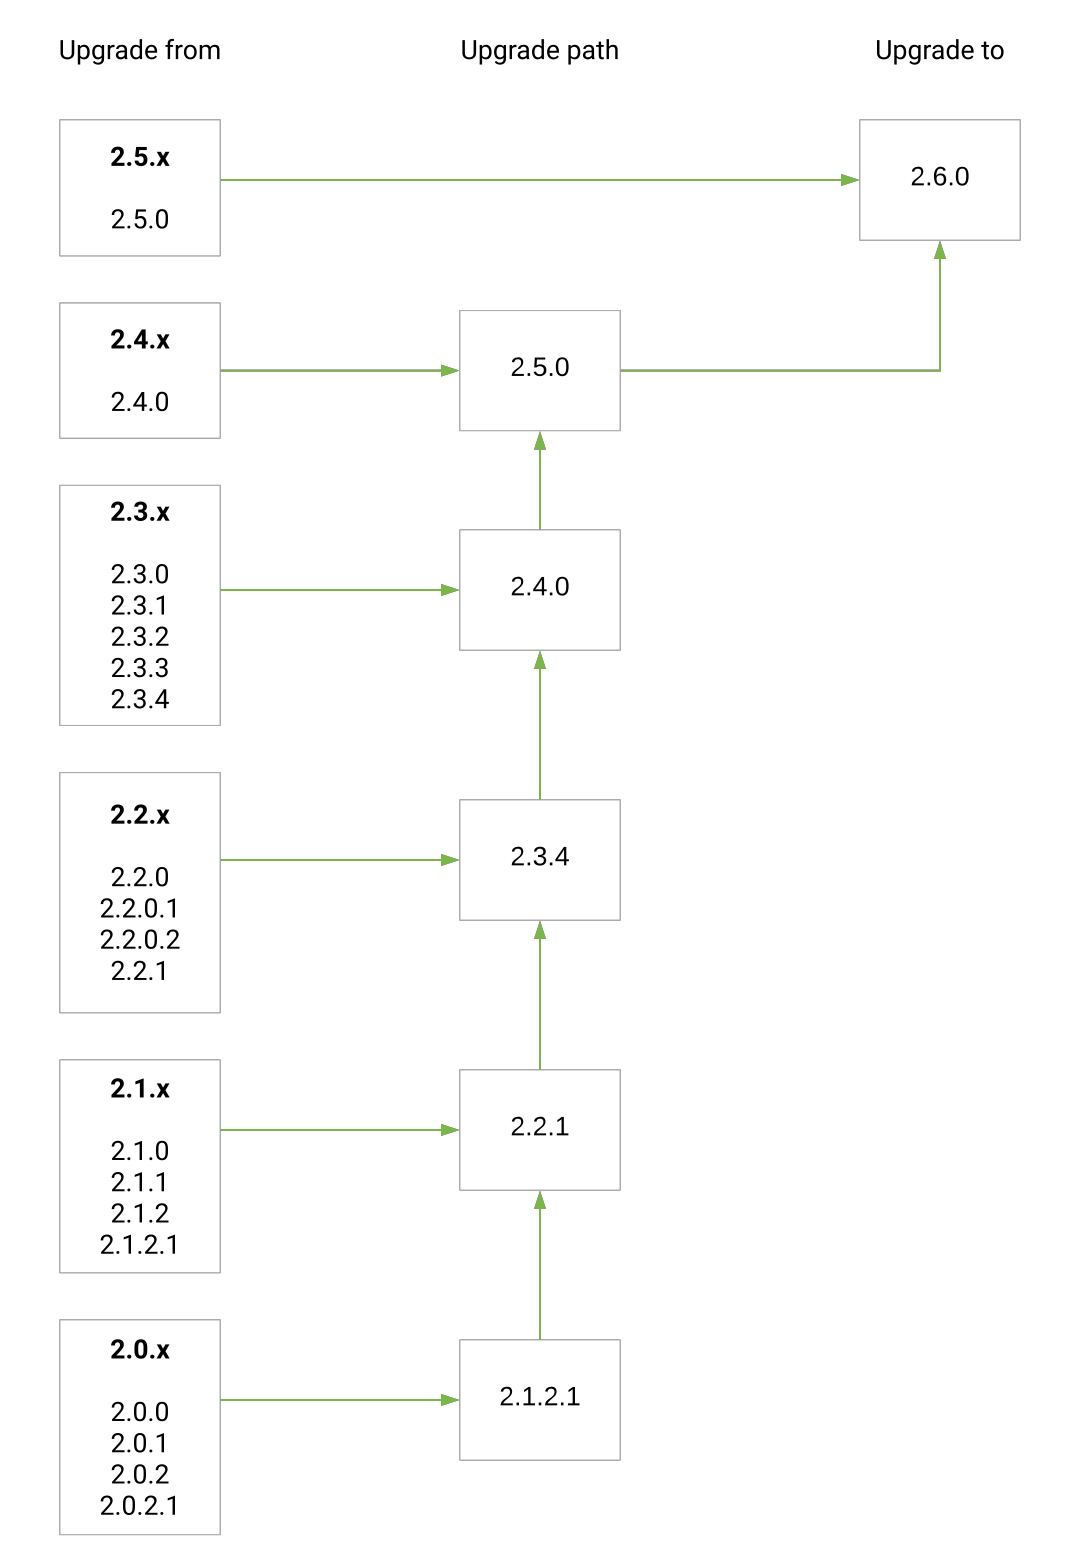
Upgrade paths from release 2.0.x(.x) to 2.6.0:
What's changed
Improvements
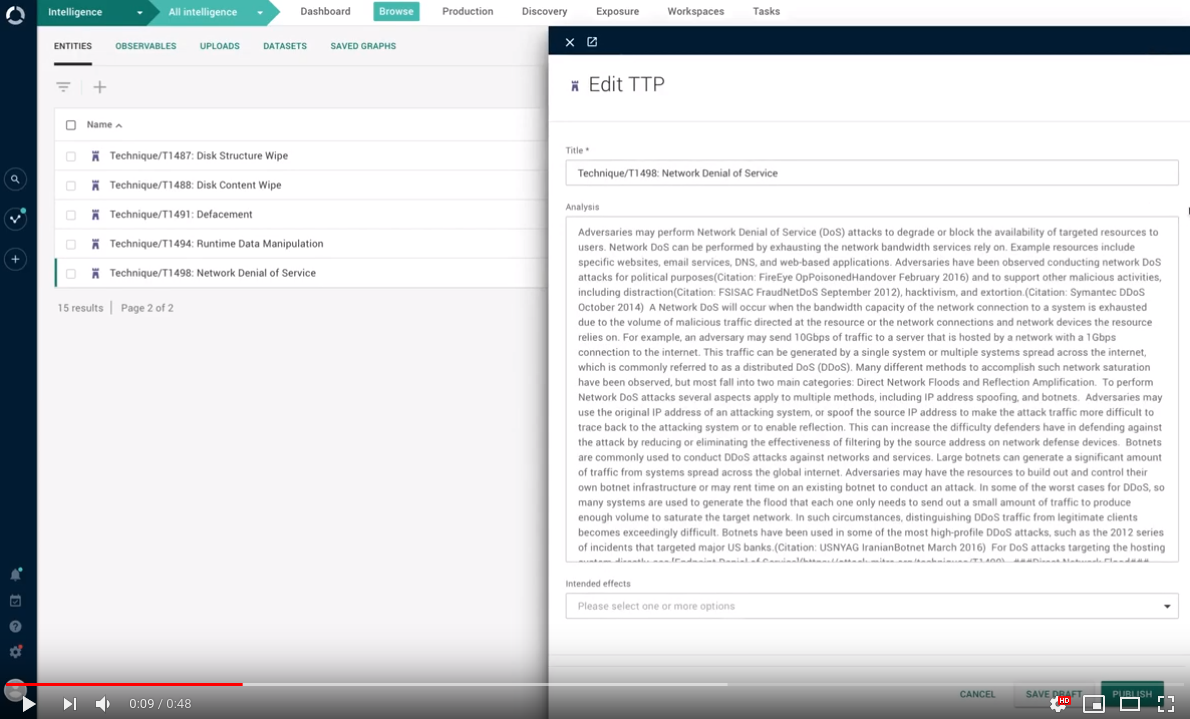
Entities: edit inside detail pane
You can now review entity detail information in the corresponding detail pane, and you can edit it without leaving the detail pane: when you enter the edit mode, the entity editor becomes available inside the pane.
This change provides a smoother, more focused workflow:
Graph
We introduced a number of improvements to the GUI to streamline the flows related to graph operations.
The result is a smoother, more consistent experience when working in the graph.
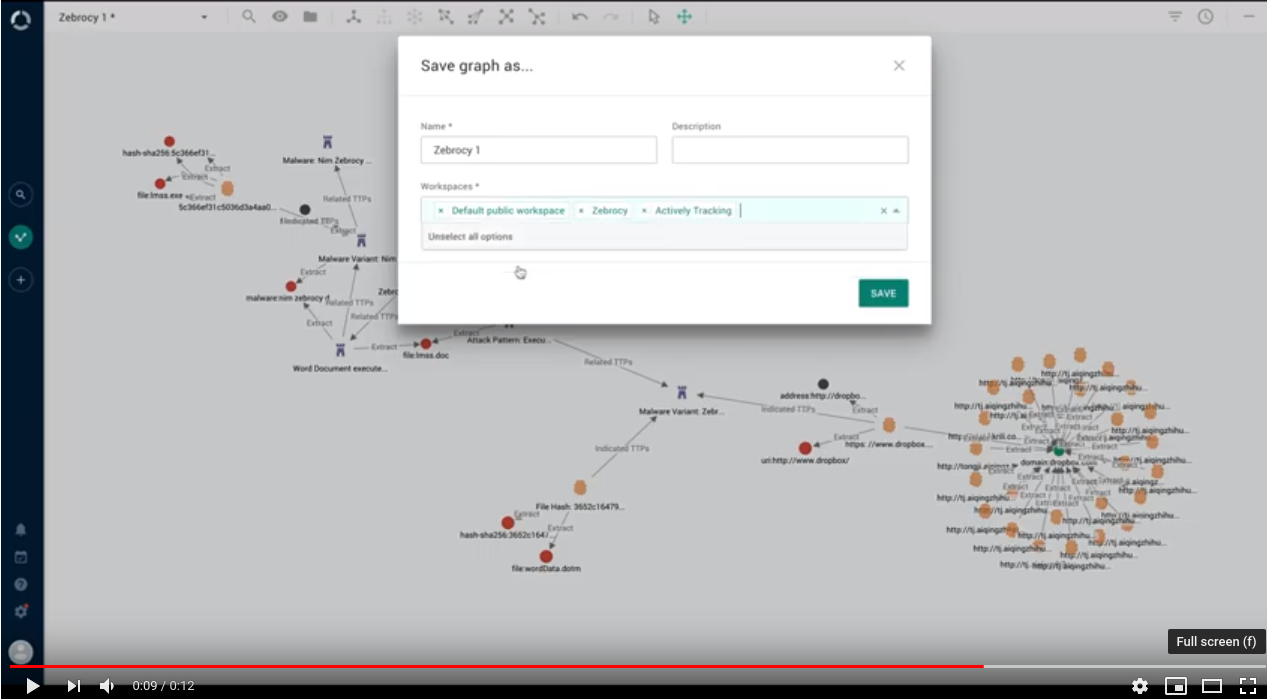
Graph: add to multiple workspaces
Gone are the times when you could save a graph and add it to only one workspace.
Now you can save it, and add it to as many workspaces as you need. In the Save graph as dialog, from the Workspaces drop-down menu select the destination workspaces you want to add the saved graph to:
Graph: display full entity titles
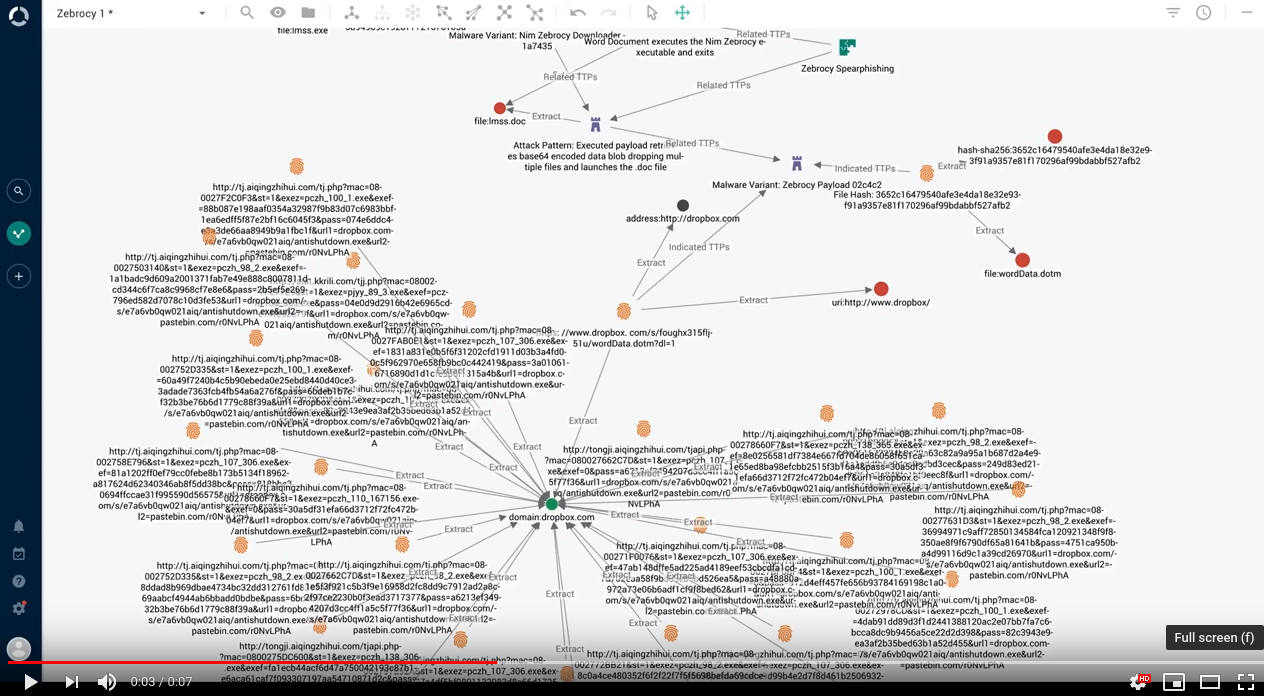
By default, entity and observable titles displayed on the graph canvas are automatically truncated to minimize visual clutter.
It is now possible to display complete entity titles on the graph.
To toggle between truncated and full titles for the entities and observables currently loaded on the graph canvas, press ALT + T (Windows and Linux) or Option + T (macOS) in an open graph:
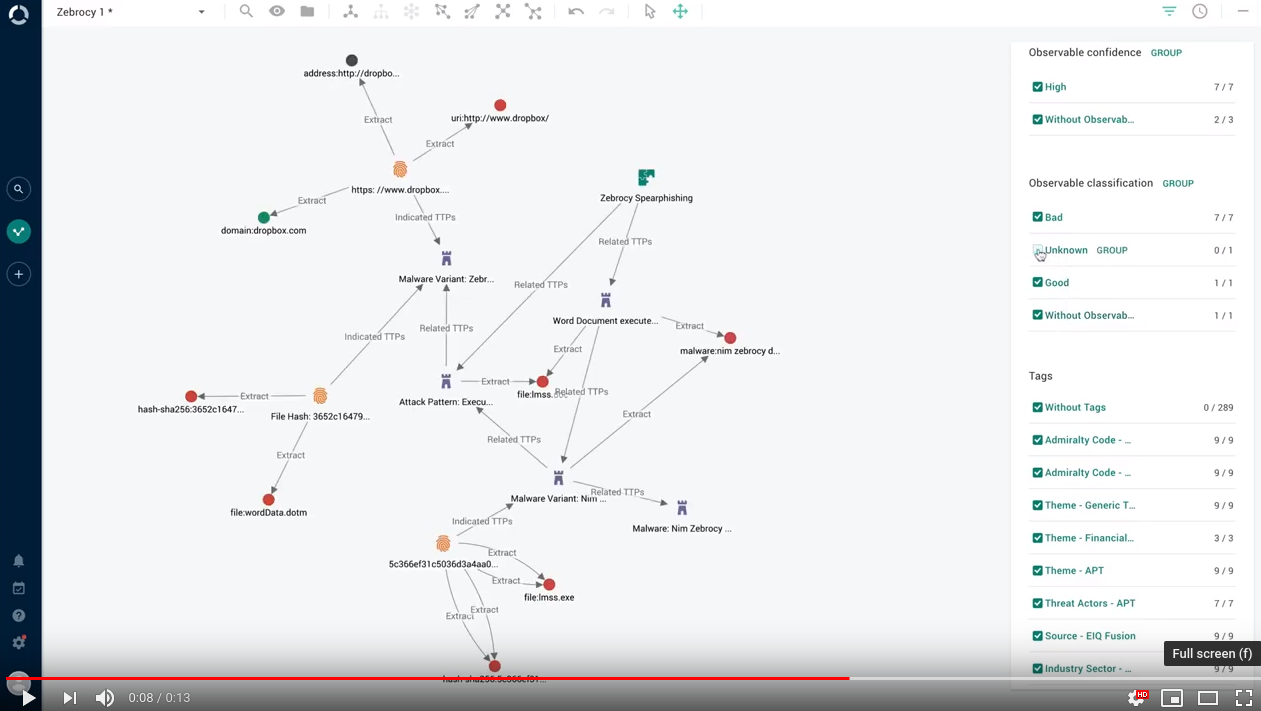
Graph: filter by observable maliciousness
You can now open the graph histogram, and select/deselect checkboxes to show and hide observables in the graph based on their assigned maliciousness confidence level:
Graph: find observable paths
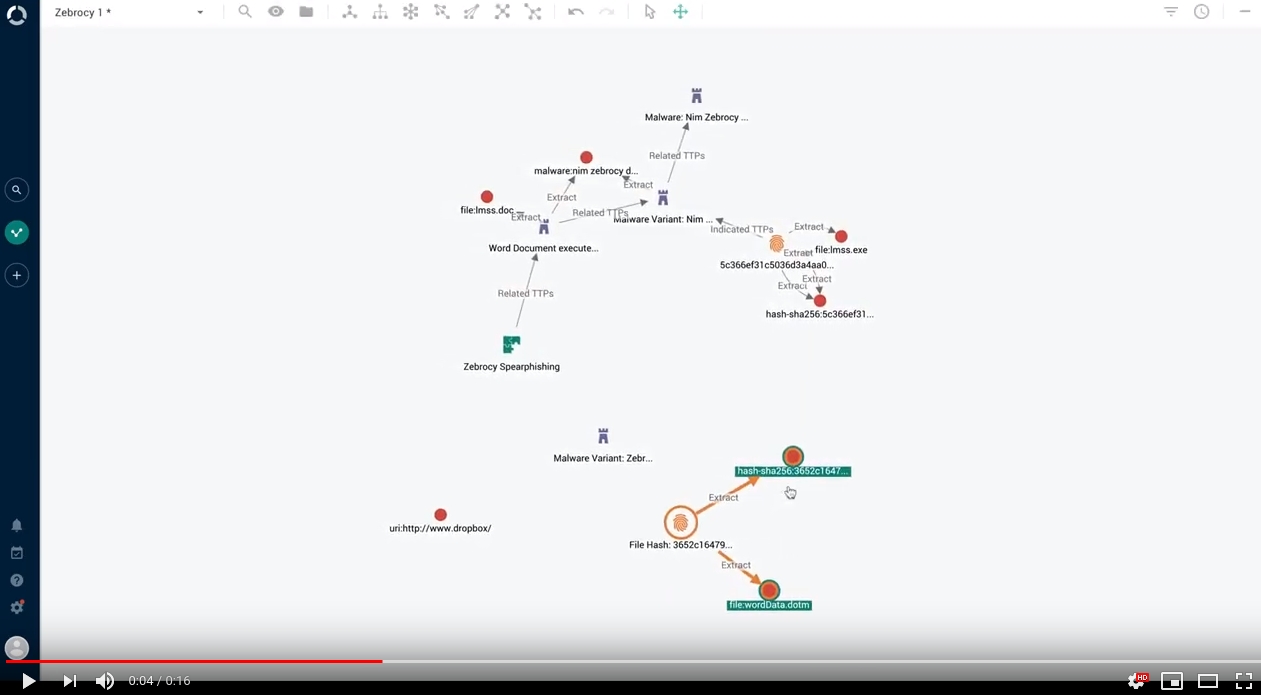
In the same way as you can find the path connecting two entities, you can now also find the path connecting two observables:
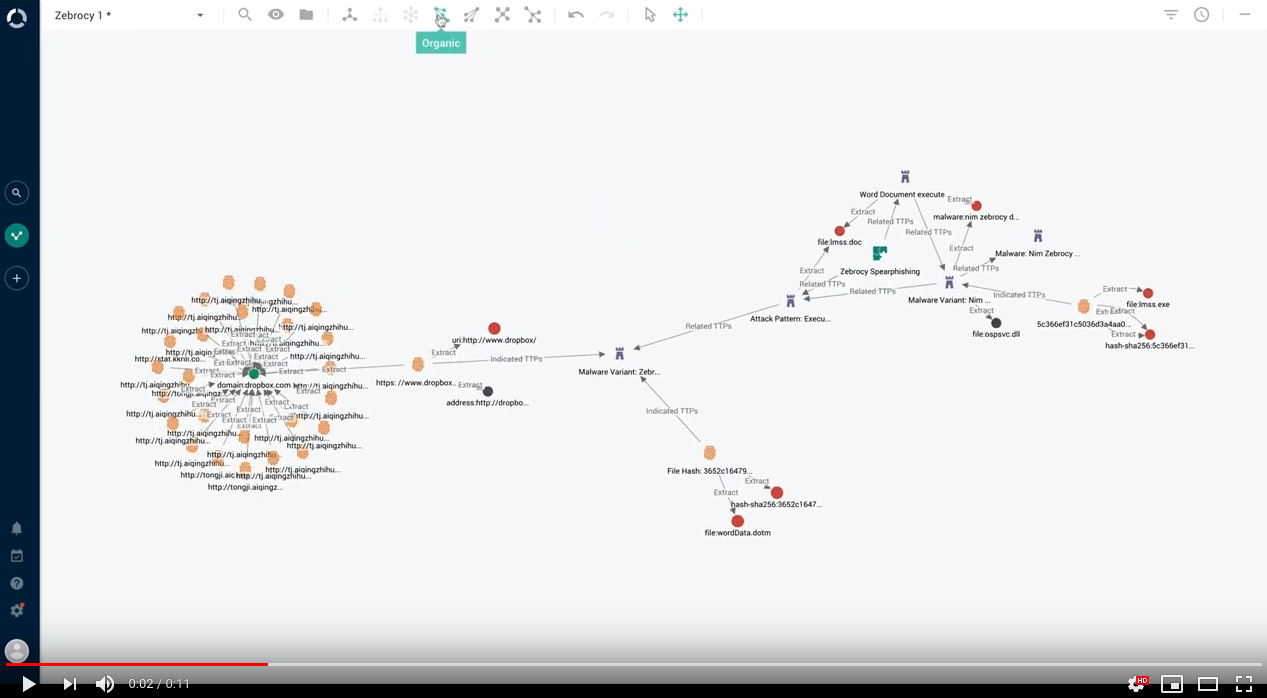
Graph: toggle the organic layout
We leveraged Keylines' organic layout. Together with Neo4j, this new layout makes it easier to identify relationships, detect clusters, and understand the overall dynamics of the landscape when a large amount of interconnected objects is loaded in the graph:
Graph: refresh on open
A populated graph canvas represents a snapshot of an intelligence landscape. It is useful to include graphs in reports to provide detail and context.
Intelligence landscapes change quickly and often, and a populated graph can go out of date because new entity versions become available, and entity relationships evolve over time.
Now the graph keeps up with your changes, and it automatically updates changed entities, observables, and relationships, so that the objects on the graph canvas are in sync with the current data in the database.
If you select an entity in the graph to edit it in the entity detail pane, saved changes trigger a graph refresh to reflect them: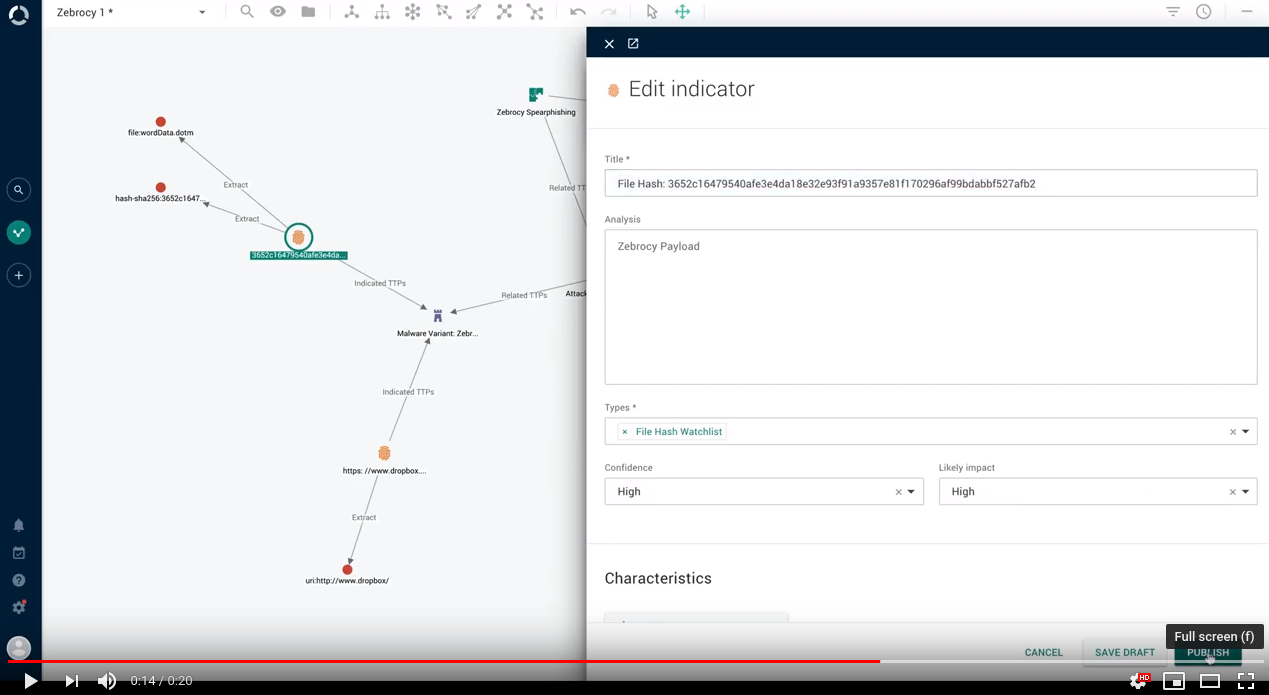
Updates propagate to entity and observable detail panes to provide a consistent experience.
Graph updates are available in new graphs, as well as in saved graphs: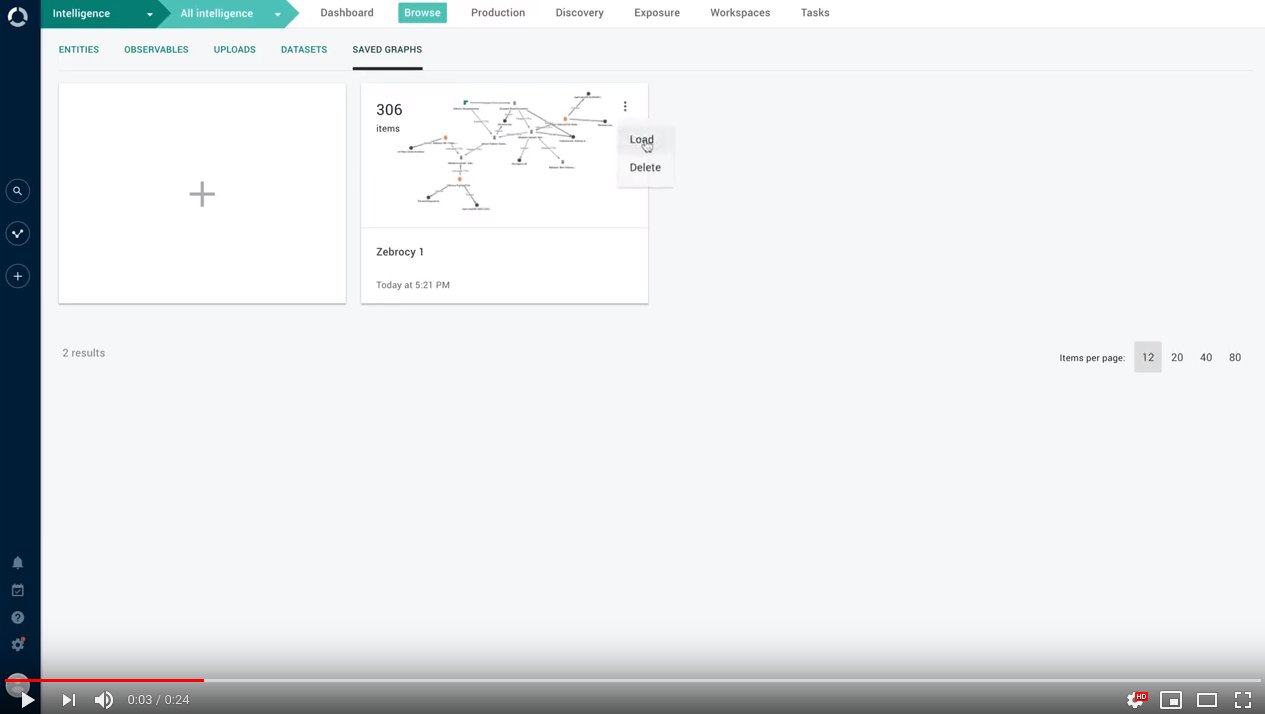
Search by destination
It is now possible to search for entities published through an outgoing feed by looking up the outgoing feed name, type, or ID: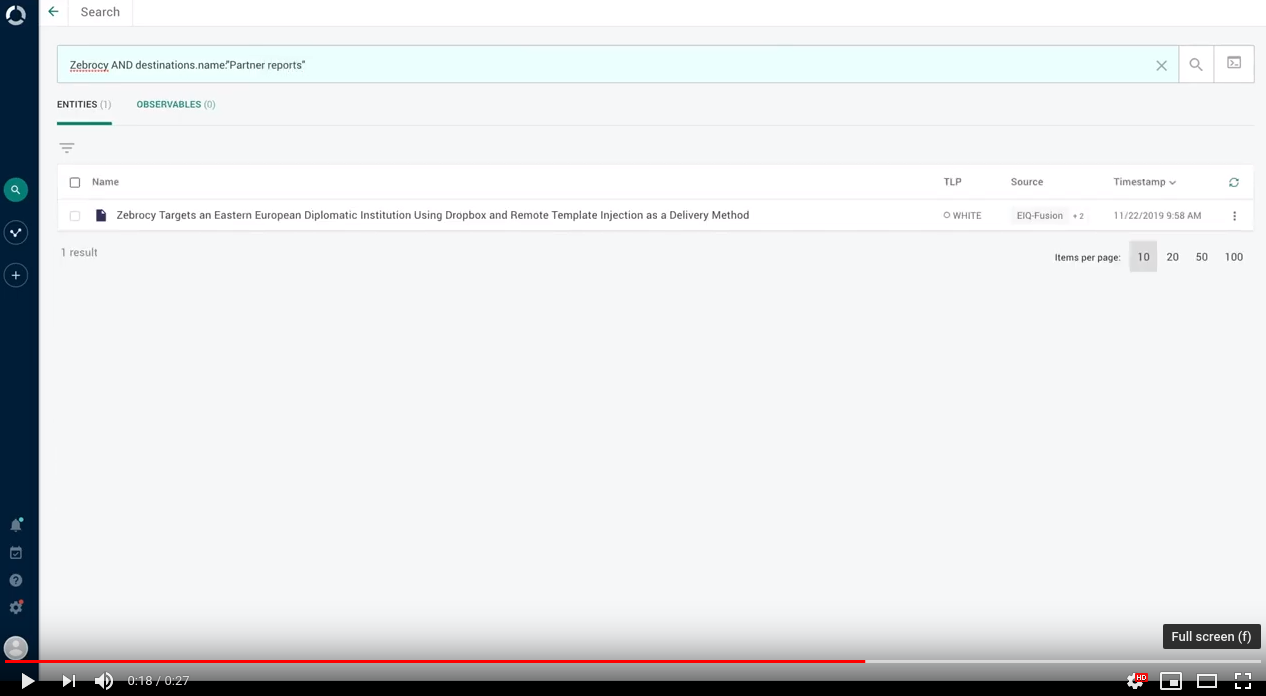
To search for entities included in the content published through an outgoing feed called "Borduria -sponsored threat actors", in the search input field enter destinations.name:"Borduria-sponsored threat actors" .
To search for entities included in the content published through an outgoing feed with HTTP download transport type, in the search input field enter destinations.type:"HTTP download" .
To search for entities included in the content published through an outgoing feed with outgoing feed ID 42 (the URL pointing to the feed ends with /outgoing-feeds?detail=42 , where 42 is the ID of the feed in the example), in the search input field enter destinations.id:42 .
Search by relationship (beta)
We are shipping search by relationship with this release as a beta feature.
We are going to include it as a full feature in an upcoming release.We'd love to hear your comments about it: share your thoughts!
It is now possible to search for entities that have relationships with a reference entity.
For example, you can search for indicators that have relationships with the TTP specified in the search query.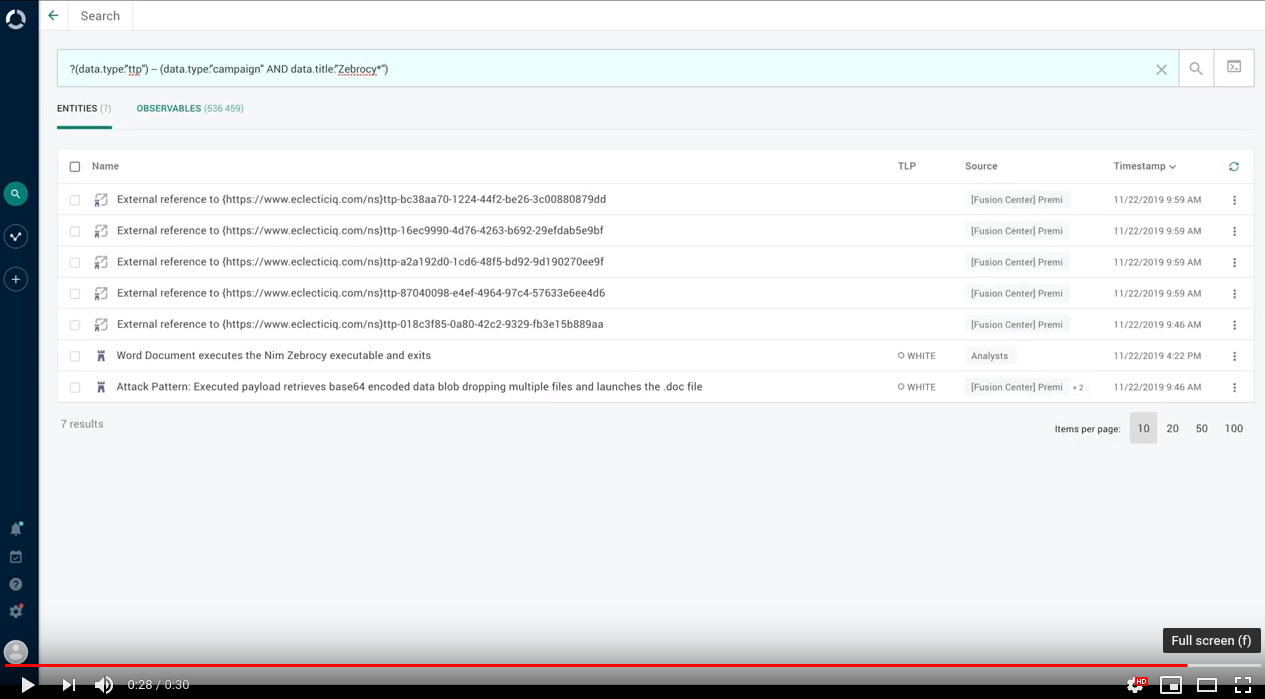
To express this type of search, we introduced a simple domain-specific language (DSL) syntax that the search input field can recognize and parse.
# Relationship query syntax?(search_criteria_defining_entity_1)--(search_criteria_defining_entity_2)In this example, the relationship search query returns all indicator entity types tagged with APT-X that have a relationship with campaign entity types ingested from the FireEye data source, and that have been created in the course of the past week:
# Searchbyrelationship example?(data.type:indicatorANDtags:["APT-X"])--(data.type:campaign AND sources.name:FireEye AND ingest_time:[now-7d TO *])
Search history
The search input field now features a drop-down menu with a history of the most recent search queries you entered.
Search entries are ordered in reverse chronological order, from most recent to oldest.
The drop-down menu displays the 7 most recent searches.
Search history features search autocomplete to help you retrieve recently used searches: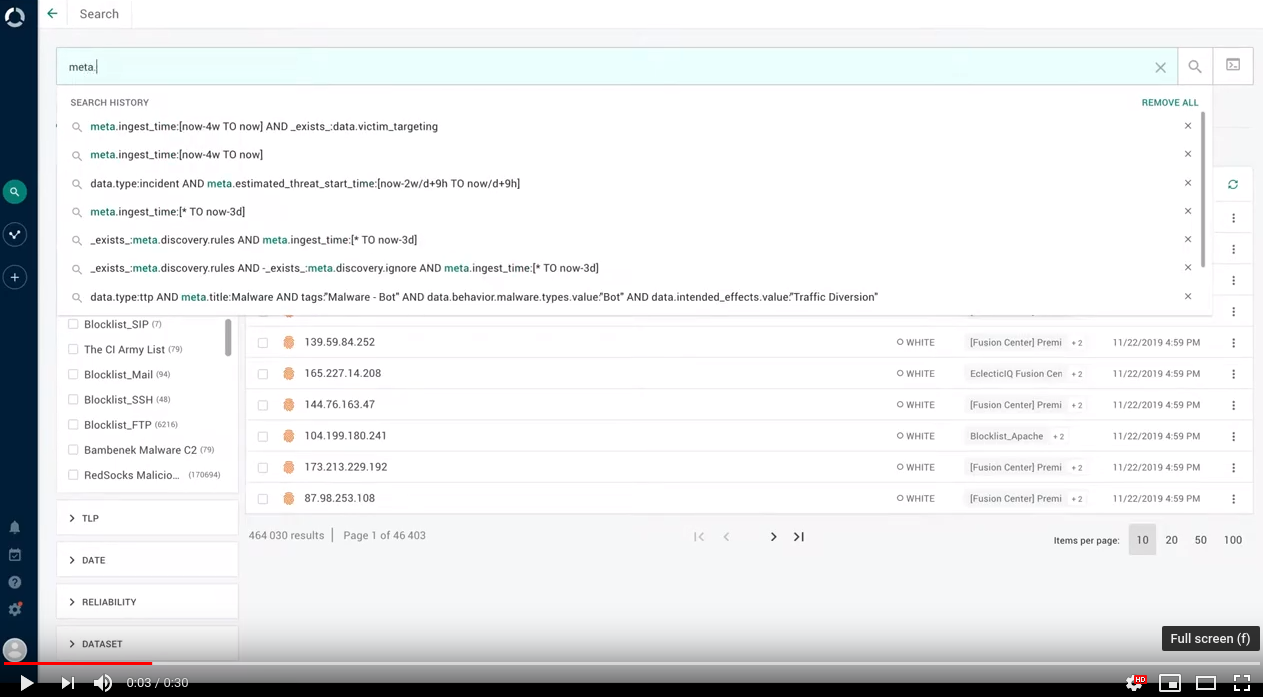
To remove an entry from this section, click the cross icon corresponding to the item you want to remove.
To completely clear the search history, click Remove all.
System health check
We expanded the range of health checks the platform performs on its system components.
Now it periodically checks that the Statsite metrics aggregator is up and running, and that it works normally.
It also checks the operating status of the mail transfer agent (MTA). By default, the platform uses Postfix.
It is possible to review the status of these health checks in the GUI, and the checks are included in the suite of diagnostic tests you can run from the command line.
Tagging
Tagging ain't what it used to be no more. This is why we restored the good old way to manage tags for individual entities.
No need to open an extra window: quickly add and remove tags in the entity detail pane.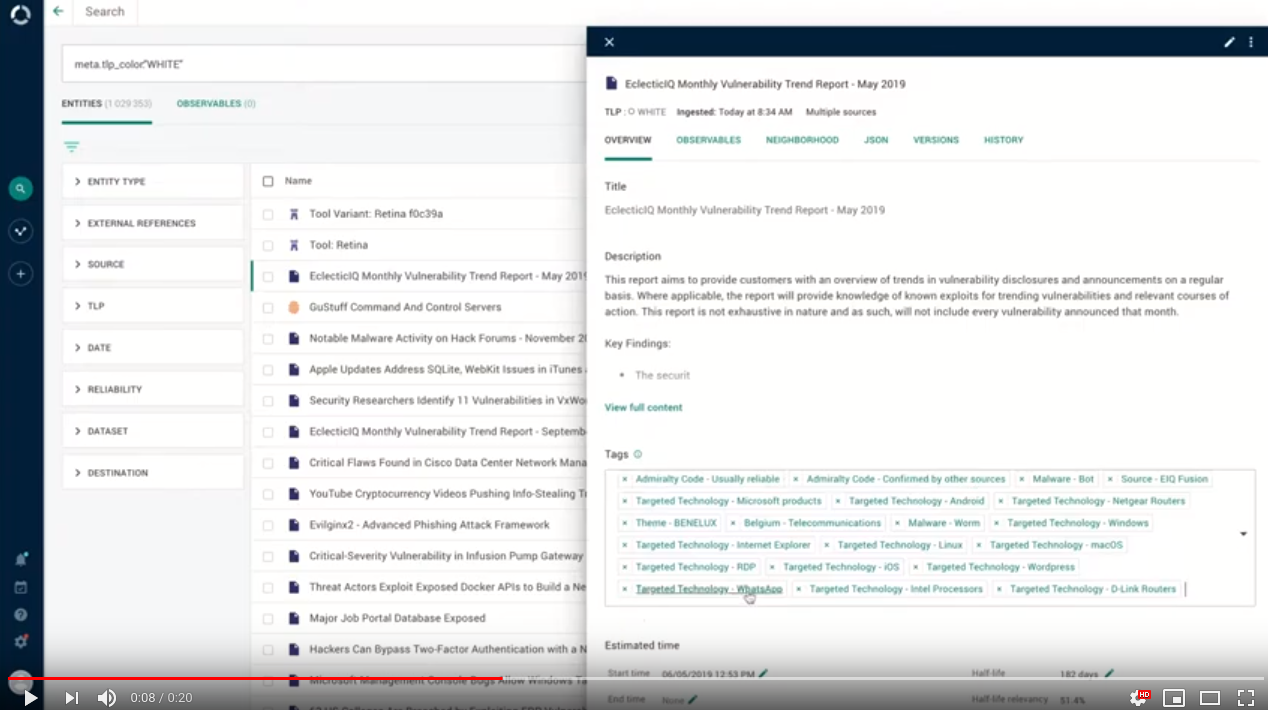
When you tag multiple entities at once, the platform detects tags that are already common to all or some of the selected entities.
This makes bulk tagging operations easier:
Important bug fixes
This section is not an exhaustive list of all the important bug fixes we shipped with this release.
In previous releases, it was possible to manually add unresolved entities pointing to external references to a dataset. This is normally not an action analysts would want to perform, since it clutters datasets with nonmeaningful data.
Now the option is no longer available for unresolved entities that refer to external data.In previous releases, merging entities may produce duplicate entity relationships.
Now an operation to merge multiple entities to a master one produces the expected relationships, without duplicating them.In the previous release, deleting an entity by selecting the corresponding option in the entity detail pane would return the following error message in the entity detail pane: "Error loading detail for the entity, it may have been deleted or updated."
Now deleting an entity from the entity detail pane removes the corresponding data from the database, and the entity is no longer available in the platform.In previous releases, viewing the full content of a report may in some cases hang without rendering the specified report.
This bug exposed an edge case, which we addressed and solved. It is now possible to correctly render and display the full content of the reports that would trigger this issue.In previous releases, entity tagging rules could take many hours to complete. Especially when retroactively tagging a large amount of entities (>300 thousand entities) with a rule that tags ingested entities from specific data sources, the rule would run slowly.
The rule mechanism underwent a number of changes to reorganize the flow of the operation, and to address rule execution bottlenecks. We improved rule performance by increasing execution speed and robustness.In previous releases, a platform instance with a large number of configured and active incoming feeds (>50), and with a large data corpus (>50 million entities) would take a long time to populate the view listing all incoming feeds.
Now the platform caches data to display in the feed overview list, and it periodically refreshes it to update the information about ingested packages. As a result, the feed overview list loads faster and smoother.In previous releases, the ##comma## delimiter used to separate multiple observables values listed together inside a single CybOX value would not be parsed correctly.
This would produce an observable whose value would be the complete list of observables in the CybOX field, and then it would extract Observable XML objects by processing the list as unstructured content.
Now the processing logic can recognize ##comma## as the default CybOX XML delimiter attribute.
The following CybOX observable types support CybOX XML delimiters:ASN
Domain
Email address
Email subject
File name
Hash
Host name
IP address
Mutex
Port
Process
Product
URI
In the previous release, it would be possible to assign a user task or a dataset to an archived workspace.
Archived workspaces are not in active use any longer; they are kept in storage for reference only.
Now it possible to assign user tasks and datasets to active workspaces, but not to archived ones.In previous releases, opening a dataset from within a workspace would cause users to leave the workspace. When opening a dataset from within a workspace, users would leave the workspace environment. They would be able to view the selected dataset inside of the global browsing environment, instead of the workspace environment.
This is no longer the case: the user now stays inside the currently opened workspace when clicking on a dataset.The time format placeholder in input fields where users can specify dates and times erroneously represented the format for hours and minutes as "h:mm".
Now it represents the correct format the field accepts and parses: hours and minutes must be in the "HH:mm" format.
Example: 23:58In release 2.5.0 the platform would detect proxy configuration settings only if they were included in the default location, that is, /etc/default/eclecticiq-platform; and also in /etc/default/eclecticiq-platform-backend-worker-common.
The workaround is no longer necessary: from this release, proxy settings in /etc/default/eclecticiq-platform are detected, and they are correctly applied.Postfix is the default MTA for the platform. In previous releases for Ubuntu Server, Postfix would not be included with the assets.
As a result, the platform would register a faulty email server health status.
Now Postfix is included in the installation packages for Ubuntu Server as a dependency.
Security issues and mitigation actions
The following table lists known security issues, their severity, and the corresponding mitigation actions.
The state of an issue indicates whether a bug is still open, or if it was fixed in this release.
For more information, see All security issues and mitigation actions for a complete and up-to-date overview of open and fixed security issues.
|
ID |
CVE |
Description |
Severity |
Status |
Affected versions |
|
- |
markdown-it is vulnerable to regular expression denial of service |
2 - MEDIUM |
|
2.5.0 and earlier. |
|
|
- |
https-proxy-agent could enable main-in-the-middle attacks |
2 - MEDIUM |
|
2.6.0 and earlier. |
|
|
A crafted PDF file could allow malicious JavaScript injection |
3 - HIGH |
|
2.5.0 and earlier. |
||
|
DOMPurify could allow XSS through SVG or MATH elements |
2 - MEDIUM |
|
2.5.0 and earlier. |
||
|
- |
A private API endpoint could provide access to unauthorized data sources |
0 - UNKNOWN |
|
2.5.0 and earlier. |
|
|
- |
marked is vulnerable to regular expression denial of service |
2 - MEDIUM |
|
2.5.0 and earlier. |
|
|
lodash enables prototype pollution |
3 - HIGH |
|
None |
||
|
Pallet Projects Flask could allow denial of service (DoS) |
3 - HIGH |
|
2.5.0 and earlier. |
||
|
Parso could allow arbitrary code execution |
3 - HIGH |
|
2.5.0 and earlier. |
||
|
- |
js-yaml 3.13.0 and earlier are vulnerable to code injection |
3 - HIGH |
|
None |
|
|
Moment.js is vulnerable to regular expression denial of service |
2 - MEDIUM |
|
None |
||
|
- |
Incoming feed with HTTP download could give access to internal components |
2 - MEDIUM |
|
2.3.0 to 2.5.0 included. |
Known issues
When you configure the platform databases during a platform installation or upgrade procedure, you must specify passwords for the databases.
Choose passwords containing only alphanumeric characters (A-Z, a-z, 0-9).
Do not include any non-alphanumeric or special characters in the password value.Systemd splits log lines exceeding 2048 characters into 2 or more lines. As a result, log lines exceeding 2048 characters become invalid JSON. Therefore, Logstash is unable to correctly parse them.
When more than 1000 entities are loaded on the graph, it is not possible to load related entities and observables by right-clicking an entity on the graph, and then by selecting Load entities, Load observables, or Load entities by observable.
When creating groups in the graph, it is not possible to merge multiple groups to one.
In case of an ingestion process crash while ingestion is still ongoing, data is not synced to Elasticsearch.
Users can leverage rules to access groups that act as data sources, even if those users are not members of the groups they access through rules.
Between consecutive outgoing feed tasks, the platform may increase resource usage. This may result in an excessive memory consumption over time.
Contact
For any questions, and to share your feedback about the documentation, contact us at [email protected] .
