Audit trail logs
Configure audit trail logging to review and to monitor Intelligence Center and system events.
To access the Audit view, you must have at least the following permissions:
read configurations
read audit-trail
All default Intelligence Center roles have the necessary permissions to access the Audit view.
Audit trail log levels
Release 2.13.0 deprecates the AUDIT_TRAIL_ENABLED option. Instead, configure audit trail logging by setting AUDIT_TRAIL_LOG_LEVEL in platform_settings.py.
Audit trail logging (`AUDIT_TRAIL_LOG_LEVEL`) can be set to four level of logging detail:
"none": No audit trail logs.
(Default) "write": Logs only PUT, POST, and DELETE requests.
"read-write": Logs GET, PUT, POST, and DELETE requests.
"extended read-write": In addition to "read-write" logging, each logged request also logs a response_body, which is a summarized version of the request’s response body. This summarized response body contains the IDs of requested resources.
Setting AUDIT_TRAIL_LOG_LEVEL = "extended read-write" produces a high log volume. Adjust AUDIT_LOG_RETENTION to limit the amount of space audit trail logs will take up.
You can limit the number of days audit trail logs are kept for by setting AUDIT_TRAIL_RETENTION. By default, this is set to 360 days (AUDIT_TRAIL_RETENTION = 360). Set AUDIT_TRAIL_RETENTION = None to retain audit trail logs indefinitely.
These fields are introduced in audit logs from 2.13.0 onward:
These fields are not yet available in the UI. Access the Kibana console on your IC instance to see the logs captured by extended audit trail logging features.
ip_address: IP address of requestor.
request_body: The body field in 2.12.x and earlier has been renamed to request_body. This logs the body of requests made to the IC.
query_string: Query string component of the logged request.
response_body: A summarized version of the response body for the logged request. This field only records ID-like fields contained in the response body. ID-like fields are fields that:
are named id
has a value that is an integer or UUID string
have names ending with _id
View the audit trail
You can view audit logs in the Intelligence Center web-based interface, as well as in Kibana.
The Audit trail records events related to:
Entities: creation, modification, deletion, failed operations.
Datasets and workspaces: creation, modification — for example, adding or removing entities to and from a dataset, or elements to and from a workspace — deletion, failed operations.
Enrichers: execution status — for example, running or pending enrichment tasks — successful or failed execution completion.
Incoming and outgoing feeds: execution status — for example, running or pending ingestion and dissemination tasks — successful or failed execution completion.
Rules: execution status — for example, running or pending rule tasks — successful or failed execution completion.
Other tasks: for example, package or file upload and download; tag, taxonomy, user, and group creation, modification, and deletion.
Authentication: failed user account authentication attempts, two-factor authentication-related events, as well as user locking and unlocking.
It records:
Login attempts for unknown, inactive, and locked users
Amount of consecutive failed sign-in attempts by the same user.
Example: Bad password #1
Locking a user after exceeding the maximum amount of consecutive failed sign-in attempts.
Example: Bad password #3: user has been locked
Unlocking a locked user.
Only administrators can unlock locked users.
Example: Updated User (id:{user_id}}): user has been unlocked
View audit logs in the web interface
To view audit logs in the Intelligence Center web-based interface:
In the side navigation bar, go to Settings
 > System settings > Audit.
Information in the Audit view relies on the Elasticsearch audit index.
If audit logging is enabled, and if the audit log file is populated, audit log records are returned.
Use the quick filters
 to look for specific audit records based on a date range, on one or more specific users, HTTP methods, or HTTP response status codes.
To show and to hide the available quick filters in the current view click
.To sort items by column header:
Click the header of the column whose content you want to sort.
Click
 or
or  to sort the content in either ascending or descending order, respectively.
|
Filter |
Description |
|
Timestamp |
Displays the search result items included in the specified time range. |
|
User |
Displays the search result items with the selected user name(s). |
|
Method |
Displays the search result items with the selected HTTP method(s): DELETE, POST, PUT. |
|
Response |
Displays the search result items with the selected HTTP response status code(s): 2xx, 4xx, or 5xx. |
|
Path |
The API endpoint acting as an interface to invoke the task or service being audited. Example: /private/entities/ |
|
Message |
An informative message describing the type of event: for example, an update, a modification, a failed sign-in attempt, and so on. |
View audit logs in Kibana
You can view audit log information also by selecting specific indices in Kibana.
Access Kibana
To access Kibana:
In the web browser address bar enter a URL with the following format:
https://${platform_host_name}/private/kibana/app/kibana#Keep the trailing #
Example: https://eclecticiq.platform.org/private/kibana/app/kibana#
View logs in Kibana
In Kibana select Discover.
In the Discover view select one of the following indices:
audit*: audit trail index.
It records events related to entities, datasets, enrichers, incoming and outgoing feeds, rules, tasks, and failed user account authentication attempts.
You can search for specific subsets by entering key/value pairs in the search input field.
Example:
method:DELETE; username:kmitnick; message:Deleted*
To select this index in the Intelligence Center GUI, in the side navigation bar click
> System settings > Audit to display the Audit tab.logstash*: it records log information related to ingestion, tasks, and task scheduling.
You can search for specific subsets by entering key/value pairs in the search input field.
Example:
*event:entities.stored; level:error; logger:eiq.platform.ingestion; tags:ingestion
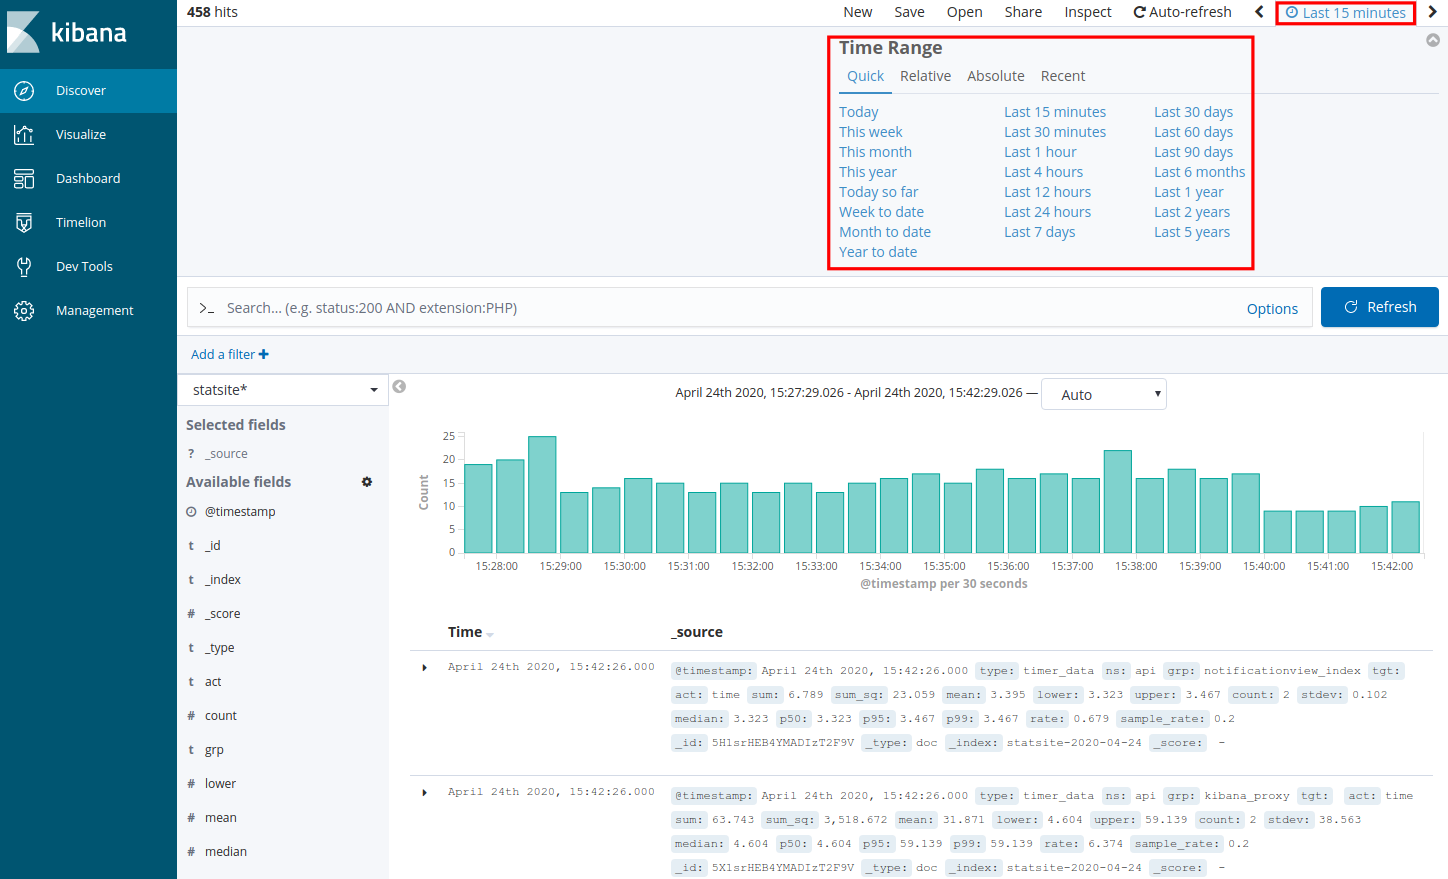
statsite*: it collects metrics about ingested and received packages, invalid or not well-formed lines in the ingested packages, as well as ingestion speed and performance.
You can search for specific subsets by entering key/value pairs in the search input field.
Example:
grp:packets_received; grp:bad_lines_seen
If audit logging is enabled, the selected audit* index returns audit log records within the specified time range.
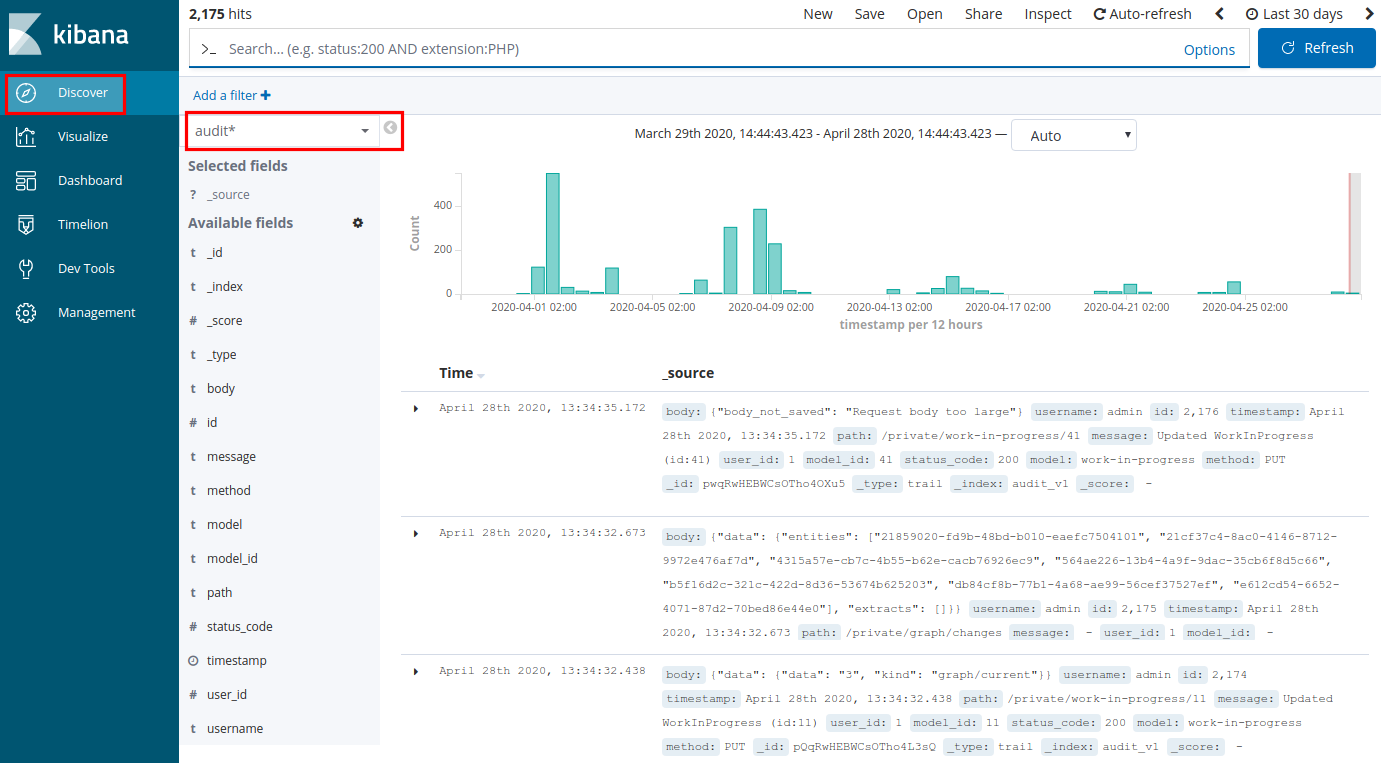
The request payload for an audit log entry cannot exceed 4 KB.
If the request body in the request payload for an audit log entry is larger than 4 KB, the following message is displayed:
"Request body too large"# Raw JSON key/value pair:"body": "{\"body_not_saved\": \"Request body too large\"}"Search audit logs in Kibana
In Kibana select Discover.
In the Discover view select the following index:
audit*: audit trail index.
It records events related to entities, datasets, enrichers, incoming and outgoing feeds, rules, tasks, and failed user account authentication attempts.
You can search for specific subsets by entering key/value pairs in the search input field.
Example:
method:DELETE; username:kmitnick; message:Deleted*
Set the update interval
By default, the log data time range search interval is set to 15 minutes: queries search for matches in logs dating from the last 15 minutes until the present time.
To adjust the time interval, in the top-right corner click the clock icon  , and choose an appropriate time range for the search.
Search by level
Log records are assigned a severity level. In this way, you can filter searches to retrieve only errors, warnings, or informative/notification log records.
To run a search by severity level in Kibana:
In Kibana select Discover.
In the Discover view select the following index:
logstash*: it records log information related to ingestion, tasks, and task scheduling.
You can search for specific subsets by entering key/value pairs in the search input field.
Example:
*event:entities.stored; level:error; logger:eiq.platform.ingestion; tags:ingestion
Enter this in the Kibana search bar…
…to obtain this result
level:"error"
Returns all logging errors.
level:"warning"
Returns all logging warnings.
level:"info"
Returns all logging information and notifications.
Search by tag
Log records are tagged, so that you can identify the Intelligence Center component a log refers to.
To run a search by tag in Kibana to look for issues or information about a specific component:
In Kibana select Discover.
In the Discover view select the following index:
logstash*: it records log information related to ingestion, tasks, and task scheduling.
You can search for specific subsets by entering key/value pairs in the search input field.
Example:
*event:entities.stored; level:error; logger:eiq.platform.ingestion; tags:ingestion
In the Kibana search bar enter this…
…to get this result
tags:"ingestion"
Returns logs related to the intelligence ingestion module controlling how the Intelligence Center ingests source data.
tags:"opentaxii"
Returns logs related to the EclecticIQ OpenTAXII server implementing the TAXII services.
tags:"platform-api"
Returns logs related to the EclecticIQ Intelligence Center API.
tags:"task-workers"
Returns logs related to services and workers carrying out backend and background tasks related to, for example, scheduling, reindexing, and prioritization.
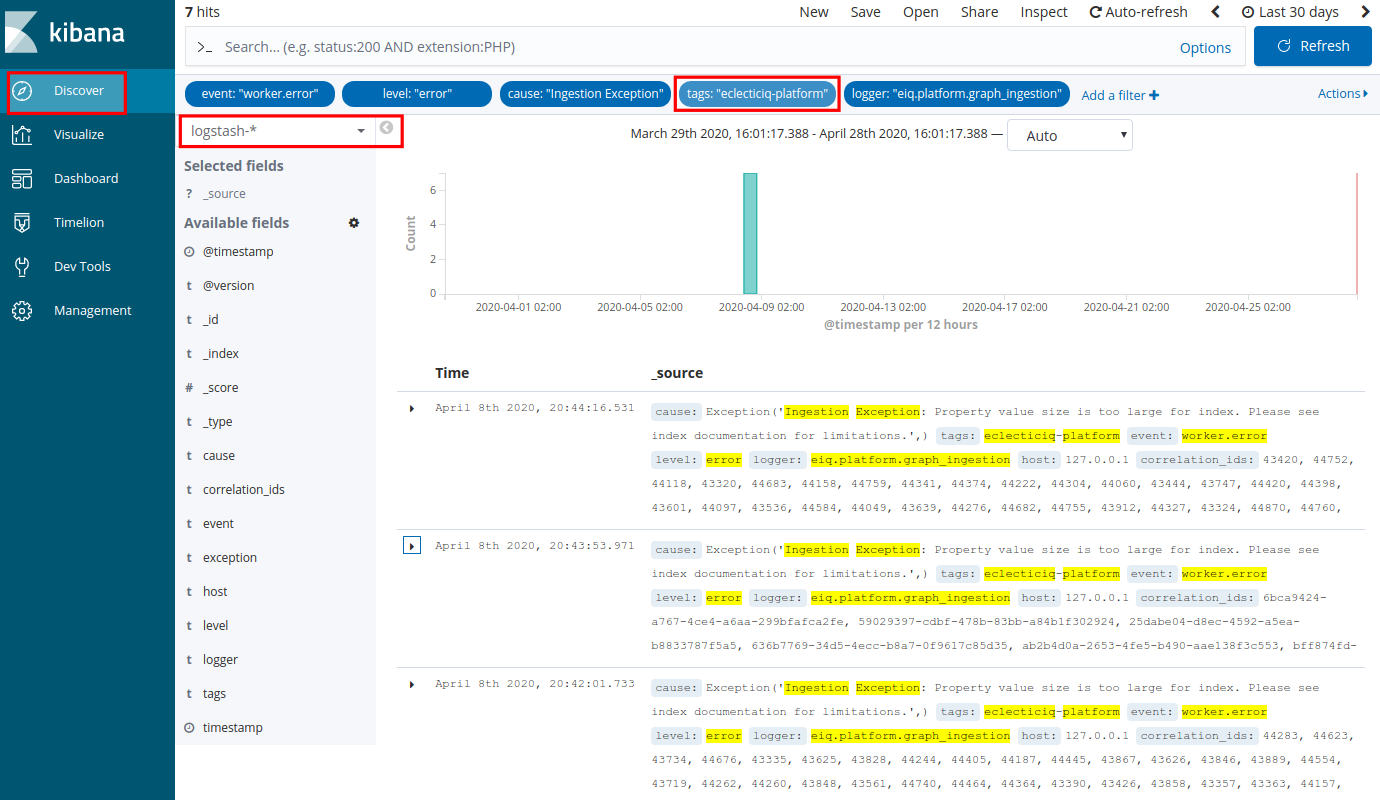
Search with Boolean operators
You can use Boolean operators to refine your search and zero in on specific log types or components.
For example, you can search for graph ingestion issues by entering the following query in the Kibana search input field:
level: "error" AND cause: "Ingestion Exception" AND logger: "eiq.platform.graph_ingestion"You can search for graph ingestion timeout issues by entering the following query in the Kibana search input field:
level:"error" AND exception:"BATCH_INGESTION_TIMEOUT" OR logger: "eiq.platform.graph_ingestion"