Check ingestion performance
To identify performance issues as part of a troubleshooting process, Intelligence Center administrators can inspect ingestion metrics to understand how long background ingestion tasks wait before execution, how long it takes to execute them, and if the execution outcome is successful or not.
About ingestion performance metrics
As part of their monitoring and maintenance tasks, Intelligence Center administrators check ingestion performance to retrieve information that can help them answer questions such as:
Is new data coming in?
How fast is the Intelligence Center ingesting data?
How long does it take to process all queues and to complete ingestion?
Are incoming feeds working as expected, or are any slow feeds creating potential bottlenecks?
Is it advisable to increase the number of concurrent ingestion workers to to boost data throughput and to reduce ingest time?
Are system resources coping with the workload, or is it advisable to scale the system up or out?
Ingestion metrics provide data that can help answer questions such as these, and to make informed decisions about which courses of actions to pursue.
In the Intelligence Center, it is possible to inspect these metrics in Kibana, where you can submit search queries to the statsite* Elasticsearch indices .
To measure ingestion performance, you can query the statsite* indices with specific metrics:
|
Search for this metric… |
…to answer this question |
|
run_time |
How long does it take to execute tasks, based on:
|
|
wait_time |
How long are tasks pending, based on:
|
|
batch_size |
What is the size of batches for tasks that support batching, based on:
|
|
enqueued |
How many packages a queue holds, based on:
|
|
deduplicated |
How many times are tasks deduplicated, based on:
|
|
failure |
How many tasks failed or were retried over time, based on:
|
|
success |
How many tasks completed successfully or were retried over time, based on:
|
View Statsite logs in Kibana
To view statsite* index logs, access Kibana.
Access Kibana
To access Kibana:
In the web browser address bar enter a URL with the following format:
https://${platform_host_name}/private/kibana/app/kibana#Keep the trailing #
Example: https://eclecticiq.platform.org/private/kibana/app/kibana#
Select the statsite* index
In Kibana select Discover.
In the Discover view select the following index:statsite*: it collects metrics about ingested and
received packages, invalid or not well-formed lines in the ingested packages, as well as ingestion speed and performance.
You can search for specific subsets by entering key/value pairs in the search input field.
Example:
grp:packets_received; grp:bad_lines_seen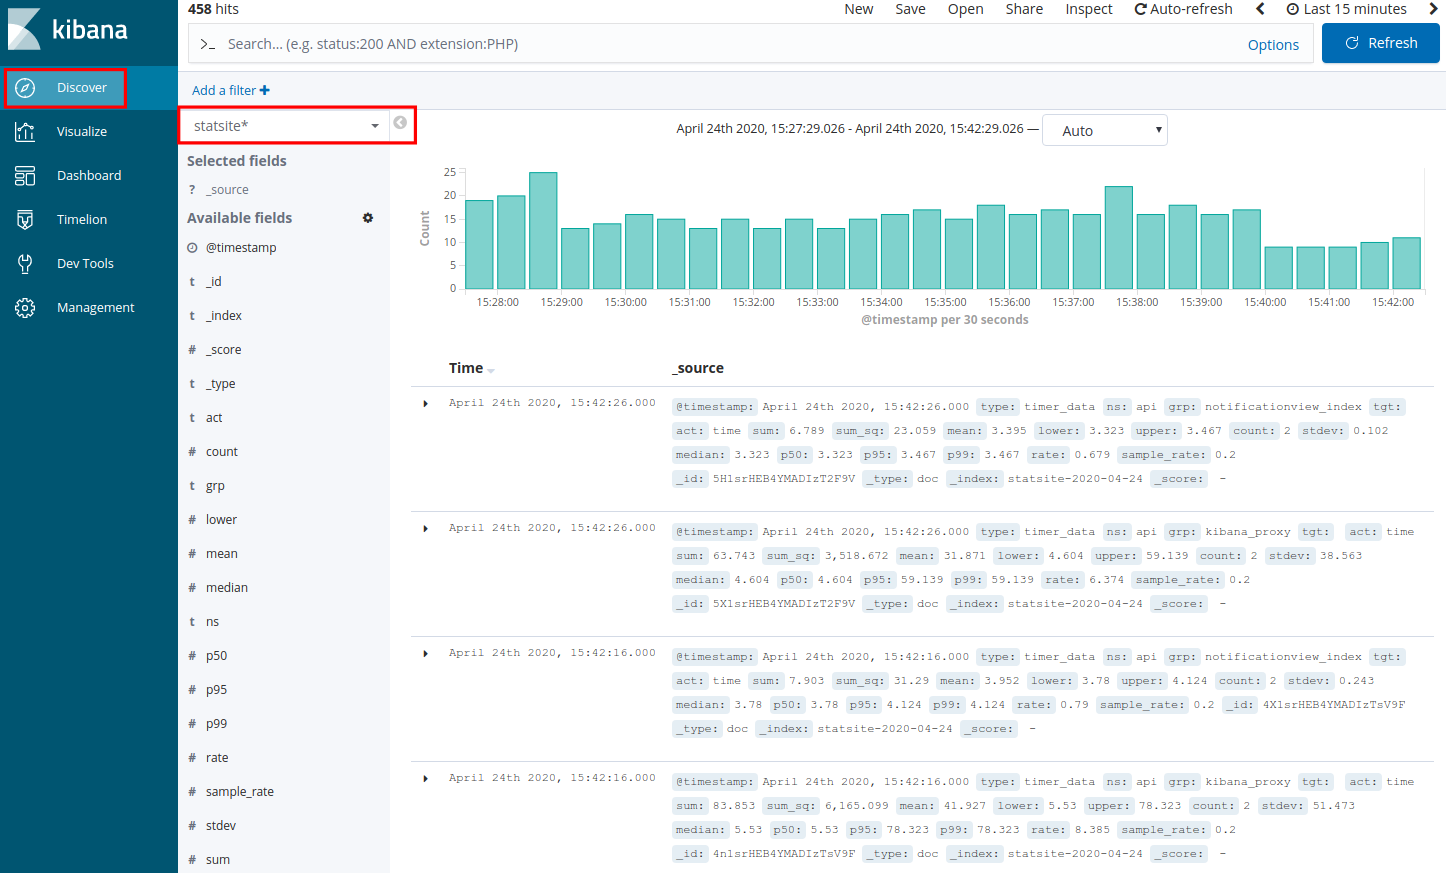
To adjust the time interval, in the top-right corner click the clock icon
 , and choose an appropriate time range for the search.
Search the statsite* metrics
In Kibana, Statsite metrics live in the ingestion namespace.
Within this functionality area, you can search for ingestion-related metrics using filters such as group, target, and action, to look for a specific metric (the action) measuring a task (the target), which controls ingestion for an incoming feed with a designated priority level (the group).
|
Search filters |
Description |
|
ns:"ingestion" |
Filters the scope. The ingestion namespace groups logs and metrics related to Intelligence Center ingestion. |
|
grp:"f${feed_id}-p${priority_level}" |
Filters functionality areas inside the namespace. Inside ingestion, this filter groups incoming feeds and their designated priority level. |
|
tgt:"${task name}" |
Filters tasks, workers, or services responsible for the functionality areas specified in the grp filter. For example, tasks that ingest and process packages, process observables and enrichments, and finalize the ingestion process. |
|
act:${metric name}" |
Filters the type of metrics used to measure an outcome. Available act metrics types:
|
|
type:${metric type}" |
Filters how metrics are expressed. Allowed values:
|
As a rule of thumb, start from a relatively loose filter, and then start drilling down as needed, based on the search results Kibana returns.
Examples
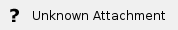
Add a filter to search the statsite* index for any ingestion metrics:
Click Add a filter +.
In the filter editor, select the following filter,
operator, and value: ns is ingestion
Click Save.
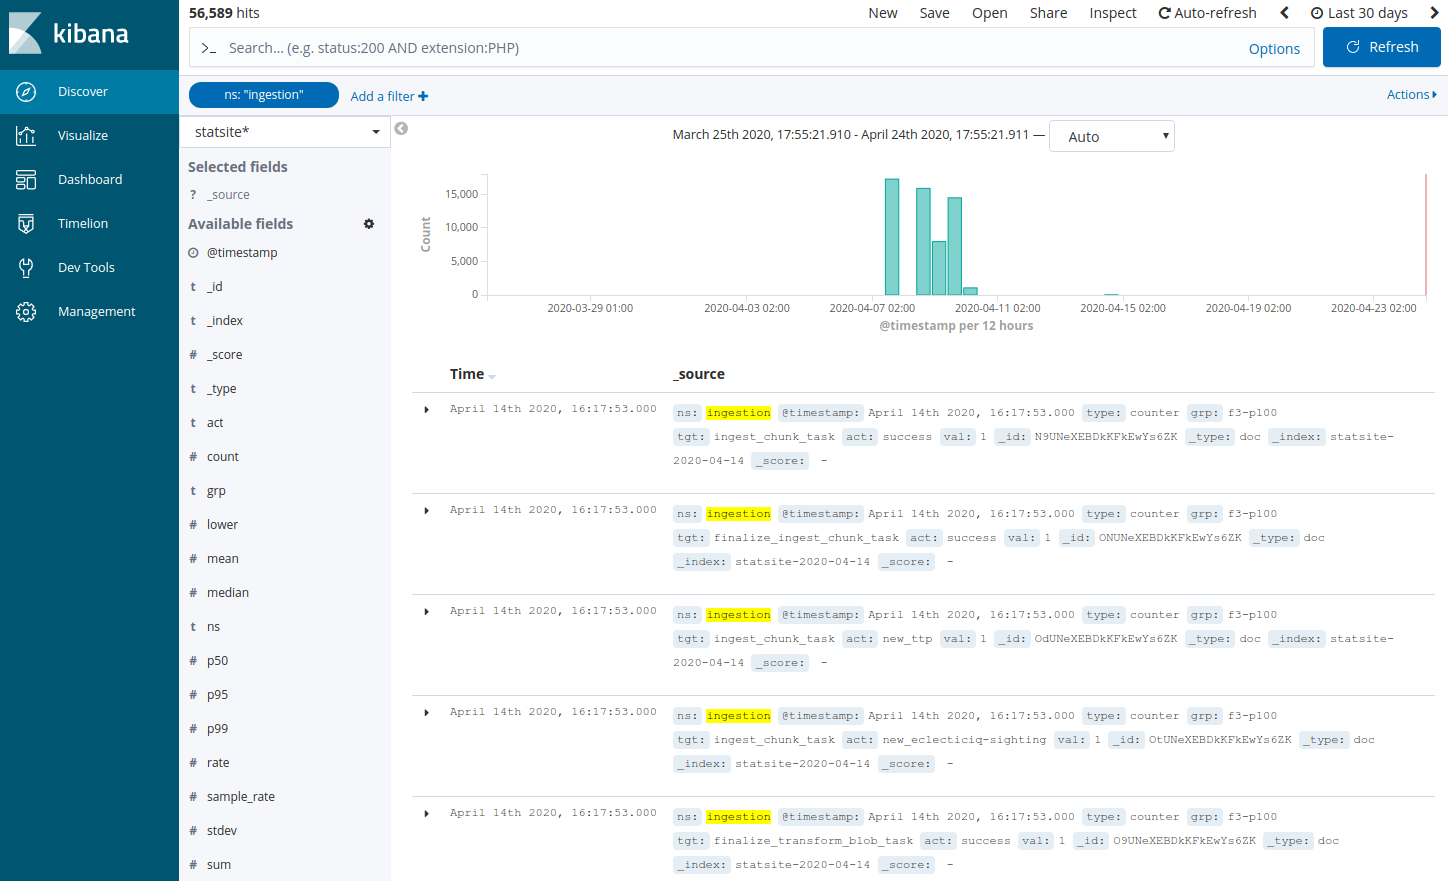
Add a filter to search the statsite* index for ingestion metrics about waiting time in ingestion queues:
Click Add a filter +.
In the filter editor, select the following filter, operator, and value: ns is ingestion
Click Add a filter +.
In the filter editor, select the following filter, operator, and value: act is wait_time
Click Save.
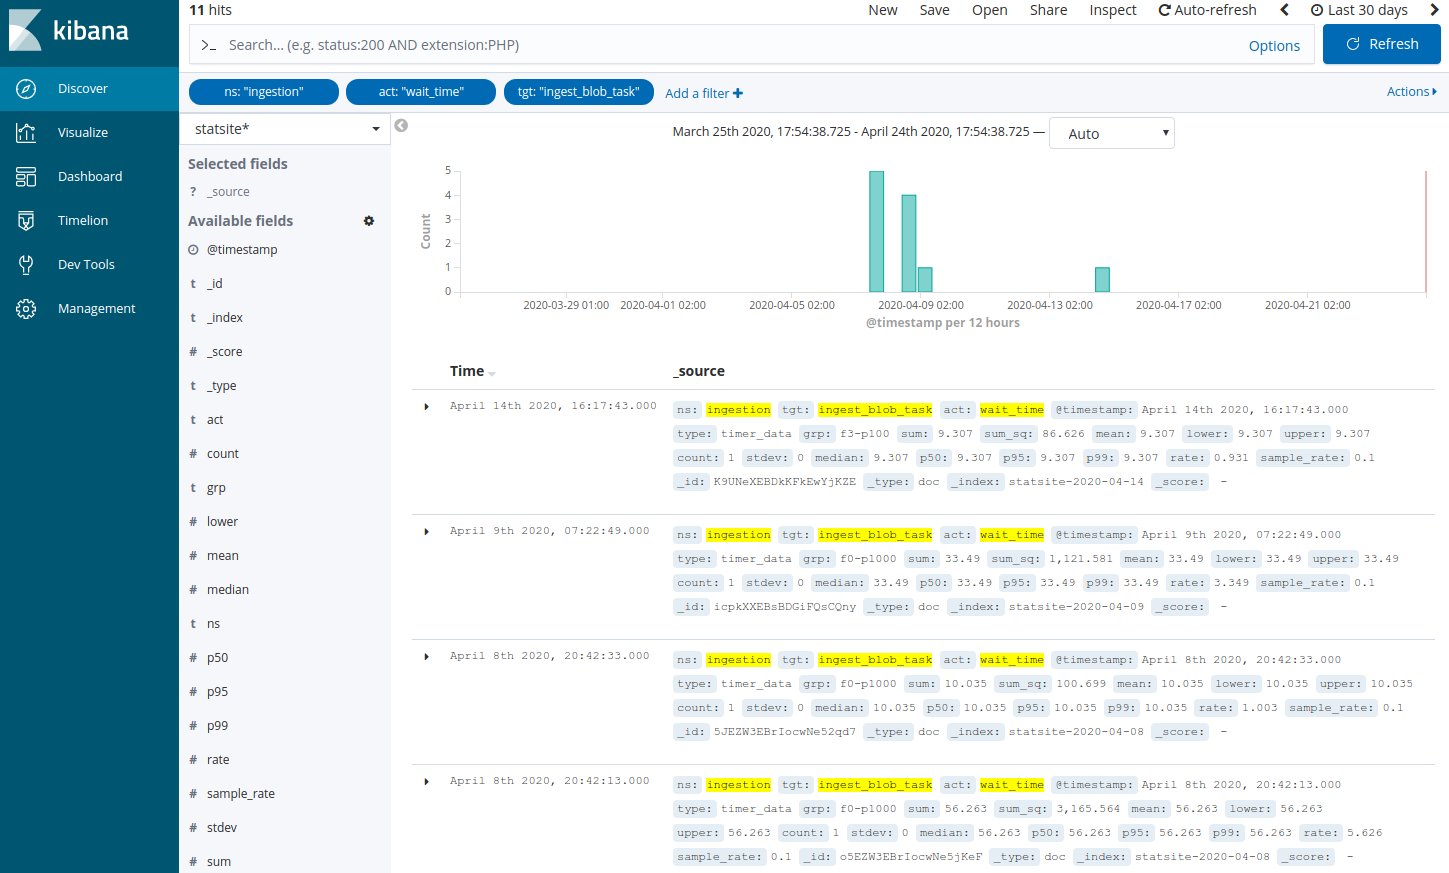
Add a filter to search the statsite* index for ingestion metrics about waiting time in ingestion queues related to the task that is responsible for package ingestion:
Click Add a filter +.
In the filter editor, select the following filter, operator, and value: ns is ingestion
Click Add a filter +.
In the filter editor, select the following filter, operator, and value: act is wait_time
Click Add a filter +.
In the filter editor, select the following filter, operator, and value: tgt is ingest_blob_task
Click Save.
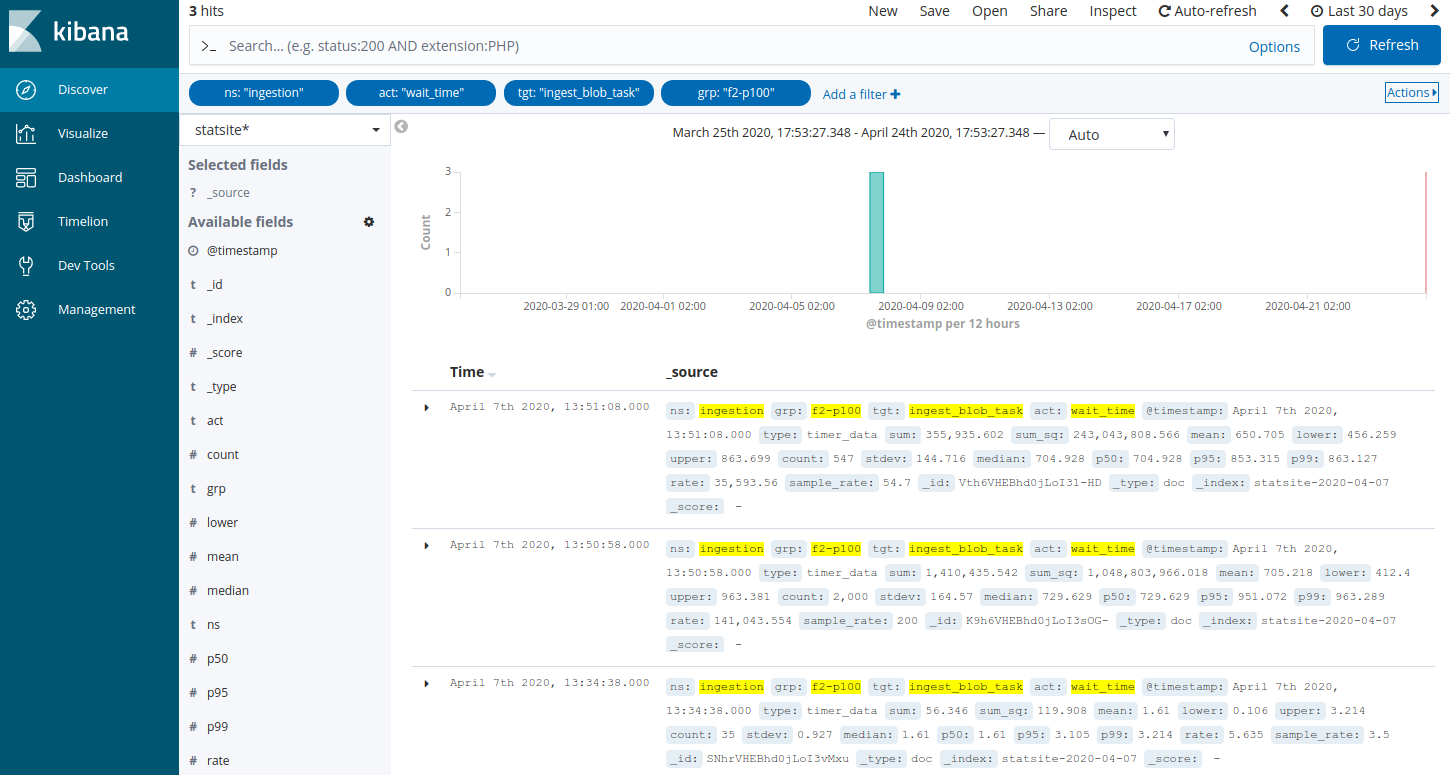
Add a filter to search the statsite* index for ingestion metrics about waiting time in ingestion queues related to the task that is responsible for package ingestion, and a specific feed with ID 2 and priority level set to 100:
Click Add a filter +.
In the filter editor, select the following filter, operator, and value: ns is ingestion
Click Add a filter +.
In the filter editor, select the following filter, operator, and value: act is wait_time
Click Add a filter +.
In the filter editor, select the following filter, operator, and value: tgt is ingest_blob_task
Click Add a filter +.
In the filter editor, select the following filter, operator, and value: grp is f2-p100
Click Save.
Visualize metrics
Metrics indicators actually stored and available for lookup may vary depending on the host environment and its configuration.
Create metrics visualizations
To explore metrics currently available in your system:
In Kibana select Visualize.
In the Visualize view click
 to create a new visualization.
In the New Visualization dialog click the Data Table visualization type.
In the Choose search source view click the statsite* search index.
In the New Visualization, statsite* view, Data tab, under Buckets, Select buckets type click Split Rows.
From the Aggregation drop-down menu select Terms.
From the Field drop-down menu select a field from the selected search index.
For example, select ns.
Click
 (Apply changes).
To adjust the time interval, in the top-right corner click the clock icon
, and choose an appropriate time range for the search.
The table is populated with the top 5 ns values in the statsite* search index.
By default, the table view includes:
The top 5 values for the selected ns namespace term.
The total number of metrics available for each namespace value.
To narrow down the search filter and to start drilling down to explore more specific metrics, add sub-buckets; that is, additional filters based on other JSON fields.
To list more specific metrics currently available in your system:
In the current statsite* view, Data tab, under Buckets click Add sub-buckets.
Under Select buckets type click Split Rows.
From the Aggregation drop-down menu select Terms.
From the Field drop-down menu select a field from the selected search index.
For example, select grp.
Click
(Apply changes).
The table is populated with the top 5 grp values for each top 5 ns value in the statsite* search index.
By default, the table view includes:
The top 5 values for the selected ns and grp namespace terms.
The total number of metrics available for each ns + grp namespace value pair.
Visualize ingestion metrics
Create a dedicated visualization in Kibana to view ingestion-specific metrics.
To explore all available metrics that measure data ingestion in the Intelligence Center:
In Kibana select Visualize.
In the Visualize view click
to create a new visualization.In the New Visualization dialog click the Data Table visualization type.
In the Choose search source view click the statsite* search index.
In the New Visualization, statsite* view, Data tab, under Buckets, Select buckets type click Split Rows.
From the Aggregation drop-down menu select Terms.
From the Field drop-down menu select act.
In the Size input field enter 100.
Click the Options tab.
In the Per Page input field, set the pagination limit to 100.
Click
(Apply changes).To adjust the time interval, in the top-right corner click the clock icon
, and choose an appropriate time range for the search.In the search input field enter ns:ingestion.
Click Refresh or press ENTER.
The table is populated with the first 100 type of metrics that measure data ingestion performance in the Intelligence Center.
The table view includes:
Up to 100 names defining the type of metrics – currently there are fewer than 100 metrics data points measuring ingestion.
The total number of metrics available for each act type of metrics.
Visualize processing time per incoming feed
Create a dedicated visualization in Kibana to review how much time incoming feed ingestion workers spend on ingesting feed data.
To review how much time ingestion workers spend on ingesting incoming data, and how much time ingestion workers spend on specific incoming feeds:
In Kibana select Visualize.
In the Visualize view click
to create a new visualization.In the New Visualization dialog click the Data Table visualization type.
In the Choose search source view click the statsite* search index.
In the New Visualization, statsite* view, Data tab, under Buckets, Select buckets type click X-Axis.
From the Aggregation drop-down menu select Date Histogram.
From the Field drop-down menu select @timestamp.
From the Interval drop-down menu select the desired time interval to use as a data bucket for the axis.
For example: Auto.
In the New Visualization, statsite* view, Data tab, under Metrics click Y-Axis.
From the Aggregation drop-down menu select Sum.
From the Field drop-down menu select sum.
Click
(Apply changes).To adjust the time interval, in the top-right corner click the clock icon
, and choose an appropriate time range for the search.In the search input field enter act:"run_time".
Click Refresh or press ENTER.
The histogram area is populated with a visual representation of the time spent ingesting data – Y axis – for the time interval bucket defined for the X axis.
You can further refine the histogram view to display the time spent ingesting data per incoming feed:
In the New Visualization, statsite* view, Data tab, under Buckets click Add sub-buckets.
Under Select buckets type select Split Series.
From the Sub Aggregation drop-down menu select Terms.
From the Field drop-down menu select grp.
Set the Size value depending on the number of incoming feeds that are ingesting data concurrently, and whose processing time you want to inspect.
For example: 20
Click
(Apply changes).
The histogram area is populated with a visual representation of the time spent ingesting data by each active incoming feed – Y axis – for the time interval bucket defined for the X axis.
Incoming feeds on the histogram are color-coded.
Feed labels include the incoming feed ID and the processing priority assigned to the feed.
Format: f${feed ID}-p${priority value}
Example: f42-p100 refers to an incoming feed with ID 42 and with priority 100.
Retrieve a feed ID
To retrieve an incoming feed ID:
In the side navigation bar, go to Data configuration
> Incoming feeds.In the Incoming feeds overview, click anywhere in the row corresponding to the incoming feed whose ID you want to retrieve.
In the web browser address bar, the URL of the active Intelligence Center view is similar to the following example:
https://${platform_host_name}/main/configuration/incoming-feeds?detail=42
In the URL, the detail URL parameter holds the feed ID.
In the example, the ID value is 42.
About incoming feed priority
Incoming feeds can be assigned a priority level to allocate more or fewer Intelligence Center resources during the ingestion process.
Feed priority is an integer within a range:
The lowest value is zero.
The highest value is set in /etc/eclecticiq/platform_settings.py :
INGESTION_FEED_PRIORITY=100By default, ingestion feed priority value is set to 100.